Rare earth elements (REEs) are a group of 15 elements referred to as the lanthanide series in the periodic table of elements. Scandium and yttrium, while not true REEs, are also included in this categorization because they exhibit similar properties to the lanthanides and are always found in the same ore bodies. REEs are key components in many electronic devices that we use in our daily lives, as well as in a variety of industrial applications.
Learn more about rare earth elements
 Uses
Uses
Rare earth elements (REEs) are used in a variety of industrial applications, including electronics, clean energy, aerospace, automotive and defence.
The manufacturing of magnets represents the single largest and most important end use for REEs, accounting for 21% of total consumption.
Permanent magnets are an essential component of modern electronics used in cell phones, televisions, computers, automobiles, wind turbines, jet aircraft and many other products. REEs are also widely used in high-technology and “green” products because of their luminescent and catalytic properties.
Rare earth elements uses, 2018

This graph shows the major industrial uses of REEs as of 2018. The largest use was in magnets (21%), followed by catalysts (20%), metal alloys (18%), polishing (15%), glass-polishing (9%), phosphors (7%), ceramics (5%), and other products (5%).
 Production
While not a current producer of REEs, Canada is host to a number of advanced exploration projects and some of the largest reserves and resources (measured and indicated) of these metals, estimated at over 15 million tonnes of rare earth oxides.
REEs are categorized as being either “light” or “heavy”:
Many of Canada’s most advanced REEs exploration projects contain high concentrations of the globally valued heavy REEs used in high-technology and clean-energy applications.
 International context
China is the world’s largest producer of REEs, accounting for over 70% of global annual production, estimated at 120,000 tonnes for 2018. The remaining 30% is mostly shared among five other countries: Australia, United States, Myanmar, Russia and India. China remains virtually the only producer of the valued heavy REEs.
| Ranking | Country | Thousand tonnes | Percentage of total |
|---|---|---|---|
| 1 | China | 120.0 | 70.6% |
| 2 | Australia | 20.0 | 11.8% |
| 3 | United States | 15.0 | 8.8% |
| 4 | Myanmar | 5.0 | 2.9% |
| 5 | Russia | 2.6 | 1.5% |
| - | Other countries | 7.4 | 4.4% |
| - | Total | 170 | 100.0% |
The United States was the world’s largest supplier of REEs until the emergence of China in the mid-1990s. China was virtually the world’s sole REEs supplier until 2012, when the now-bankrupt US producer Molycorp Inc. and the Australian company Lynas Corporation Ltd. commenced commercial production.
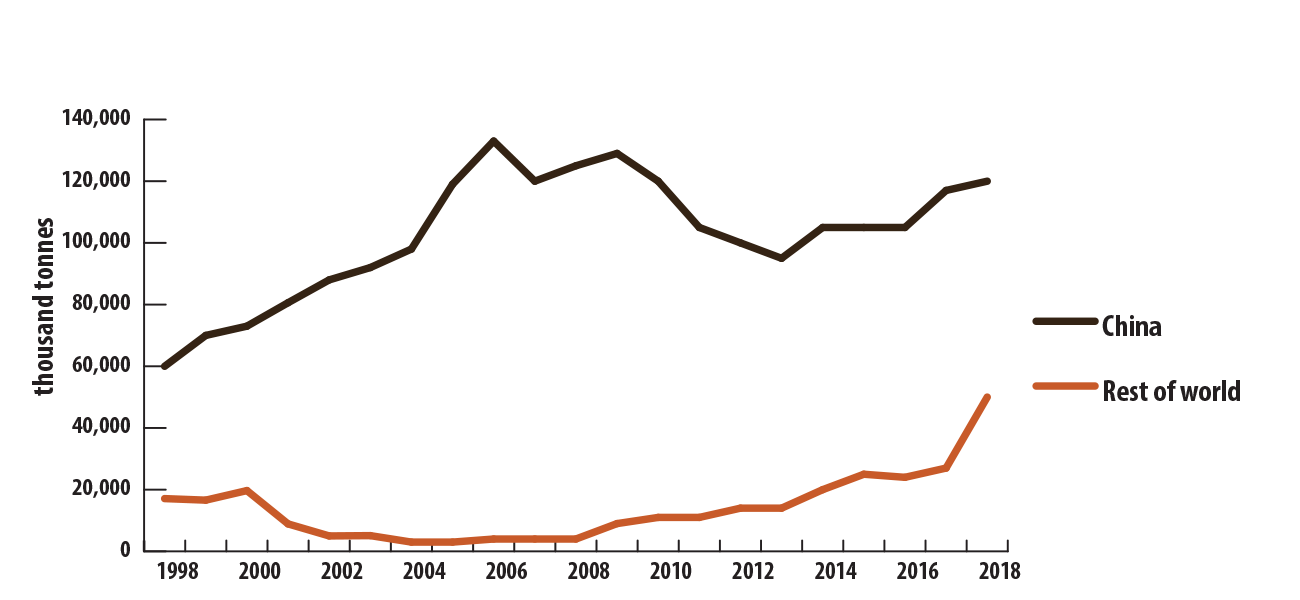
World REEs production, 1988–2018 (p)

This 30-year graph shows REE production by China compared with the rest of the world. In 1988, China’s production was estimated at 30,000 tonnes while the rest of the world had an estimated production of 15,000 tonnes. By 2006, China’s production was estimated to have reached 135,000 tonnes, while the rest of the world produced 3,000 tonnes. In 2018, China produced an estimated 120,000 tonnes, while the rest of the world produced an estimated 50,000 tonnes.
(p) preliminary
Totals may be different because of rounding.
Uses
Rare earth elements (REEs), global uses, 2018
Canadian Rare Earth Elements Network
Production and resources and reserves
Reserves and resources
Natural Resources Canada, compiled from company reports
Includes reserves and minerals resources (measured or indicated). While Canada’s REEs
resources continue to exist, projects may be on hold and the corporate entities developing
these resources may no longer be solvent or have focused efforts on other mineral deposits or business segments.
Canada-based advanced REEs exploration projects, 2018
Natural Resources Canada; Company reports
International context
World production of REEs, by country, 2018 (p)
United States Geological Survey Mineral Commodity Summaries 2019
World REEs production, 1988–2018 (p)
United States Geological Survey Mineral Commodity Summaries 2019
Copyright © 2020. we All rights reserved.